Postmortem: when a routine backup freezes an entire server

A business database server (proprietary DBMS engine, on Ubuntu 22.04) froze one afternoon during a backup that had been running for months without a single incident. Eight minutes of downtime, no data lost, but I eventually traced the freeze back to a memory saturation event the previous night, through a seemingly completely different mechanism.
The symptom: a server that stops responding to anything
4:30 PM. The hourly backup to the NAS starts as it has 24 times a day for months. Nothing unusual.
4:36 PM, the server stops responding. SSH won't connect, monitoring has nothing left to display, application logs stop dead. No error message, no usable trace at the time of the event (just complete silence).
4:42 PM, out of options, I physically restarted the server via the power button. It comes back normally two minutes later, the database restarts, no corruption detected.
Immediate takeaway: 8 minutes of downtime, zero data loss, and an open question: what could possibly freeze a machine with 62 GB of RAM and an NVMe drive, on a routine operation that had run without issue for months?
The diagnosis: vm.dirty_background_ratio left at its factory value
On Linux, disk writes don't go out immediately: they accumulate in memory ("dirty pages") and a background thread (kworker) gradually flushes them to disk. Two thresholds drive this mechanism:
vm.dirty_background_ratio: the percentage of RAM in dirty pages at which the kernel starts writing in the background, without blocking anyone.vm.dirty_ratio: the threshold beyond which any process that writes must itself wait for room to free up, synchronously.
Digging in, I found these thresholds left at Ubuntu's defaults (designed for an era when servers had a few GB of RAM, not 62).
$ sysctl vm.dirty_background_bytes vm.dirty_bytes vm.dirty_ratio vm.dirty_background_ratio
vm.dirty_background_bytes = 0
vm.dirty_bytes = 0
vm.dirty_ratio = 20
vm.dirty_background_ratio = 10
dirty_background_ratio=10 on 64 GB gives several GB of headroom in theory. Except that wasn't the real margin: the calculation is based on free memory, not total RAM, and that day the actually available memory was far lower than it should have been (see below). What I actually measured: around 66 MB of headroom before the reactive cleanup mechanism kicked in seriously (for a backup writing at 146 MB/second).
The buffer zone amounted to less than half a second of margin. Once exhausted, every process that wants to write has to wait first for room to free up, including jbd2, the thread that holds the ext4 filesystem's journal and guarantees its integrity. It ended up stuck waiting on memory, and since nothing can write to disk without going through the journal, the entire system stopped along with it: the database, monitoring, system logs.
jbd2 has nothing to do with the DBMS: it's a kernel component, one per ext4/ordered filesystem mounted with journaling. The freeze therefore wasn't an application-level problem: any process attempting to write at the same moment would have suffered the same fate. This is why monitoring itself went silent instead of alerting.
Why that day, and not the 200 before it
The most instructive part of my investigation: the same backup, with the same volume, ran without a hitch the following morning. Comparing the two runs was more useful to me than examining the failure alone.
| Incident day, 4:30 PM | Following day, 8:30 AM | |
|---|---|---|
| Free memory before the backup | 18.3 GB | 24.9 GB |
| Memory consumed by the backup | 17.3 GB | 17.1 GB |
| Lowest remaining memory | 0.95 GB | 6.3 GB |
| Result | freeze | done in 3 minutes |
The backup consumed almost the same amount both days. What changed was the margin it started with: 6.6 GB less on the incident day. The system had therefore been running for months with an already fragile memory margin, invisibly, until the day it dropped below the critical threshold.
The false leads, ruled out one by one
Before concluding, I examined and ruled out four hypotheses, with evidence: the least glamorous part of the investigation, but the one that keeps you from fixing the wrong thing.
Is the disk failing? No: checked, smartctl shows no hardware error over the previous 7 days.
Did the DBMS engine crash? No. The engine was blocked like everything else at the same instant: it suffers the freeze, it doesn't trigger it.
Is the NAS backup driver at fault? Tempting lead at first glance: the driver (Synology Active Backup) shows an error message at the end of the backup. On closer inspection, this message had appeared 16 times since the last reboot without ever causing the slightest freeze, and the available upstream fix is documented as a mere log-noise reduction, not a bug fix. Recompiling a low-level kernel component in production to suppress a harmless message would have been a gratuitous risk. Lead abandoned.
Is it the same mechanism as the memory saturation that happened the following night (see below)? On the surface, no: two different symptoms, two different times. But digging into this question eventually revealed they share the same root cause.
The deeper cause: a job that rereads the entire database every night
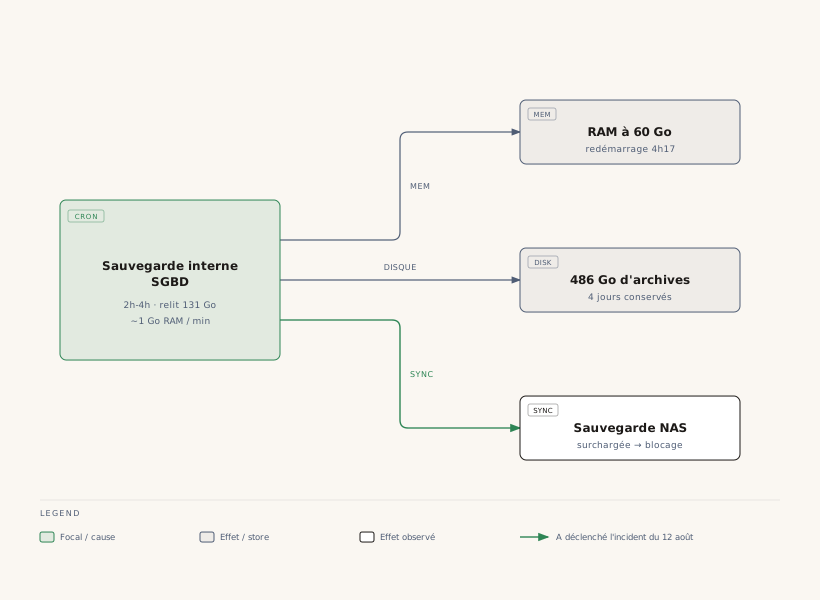
While looking into why the memory margin was so low that day, I traced it back to a phenomenon that had nothing to do with the NAS backup: an internal backup job built into the DBMS engine, running every night from 2 AM to 4:06 AM.
The engine's (dbengine64) memory behavior is perfectly stable during the day:
10 PM to midnight, 120 readings at 1-min intervals: stable consumption, 3 MB variation
Then, at exactly 2:55 AM, consumption takes off:
02:54    4.7 GB
02:55    5.3 GB
02:58   12.4 GB
03:12   27.8 GB
03:5x   60.4 GB   ← on a machine with 62.5 GB total
About 1 GB per minute, for an hour. This isn't a gradual leak, it's a command: this job rereads the entire 131 GB of database files through the engine, and the engine keeps everything it's read in memory.
The problem is that this memory isn't reclaimable the way a classic disk cache is. The kernel's page cache can be dropped instantly the moment a process needs room: everything it holds already exists elsewhere on disk. The engine's private memory, on the other hand, isn't visible to the kernel as reclaimable cache: the only way for the system to free it is to page it out to swap, page by page (slow, and it blocks everything else while it waits).
That night, swap (8 GB) eventually filled up completely, and the service auto-restarted at 4:17 AM.
Three symptoms, one origin
This is where the two incidents, initially handled separately, converge:
| Observed symptom | Origin |
|---|---|
| Engine RAM climbs to 60 GB and the service restarts at 4:17 AM | the job rereads 131 GB through its private memory |
| 486 GB used up on local disk | the job writes its archives there, 4 days of history kept |
| The server freezes on August 12 at 4:36 PM | those 486 GB of archives are seen as "new" data by the external backup, inflating its volume and duration |
The disk was 72% full, of which 486 GB were local backups for only 131 GB of live data. In other words, the backup to the NAS was spending most of its time... backing up backups.
The fixes, applied without service interruption
1. Widening the memory buffer zone. I set vm.dirty_background_bytes explicitly to 2 GB (instead of a percentage calculated on an already fragile free-memory figure), with more responsive flushing:
# /etc/sysctl.d/99-dirty-pages.conf
vm.dirty_background_bytes = 2147483648
vm.dirty_bytes = 4294967296
To put the order of magnitude in perspective: the reaction margin goes from about half a second to more than 6 seconds at 146 MB/s. Cost: 2 GB of RAM permanently reserved, i.e. 3% of the total (well acceptable on a 62 GB machine).
2. Smoothing out writes. The dirty_bytes threshold (beyond which the system forces synchronous writes) was lowered to spread the load out instead of concentrating it in bursts.
An initial estimate proposed capping dirty_bytes at 1 GB. On checking a full day of production, real peaks of pending writes reached 5.3 GB: a 1 GB threshold would have permanently slowed the database down, well before any incident. The value was corrected to 4 GB before applying it. Without that check, the fix would have replaced a rare incident with permanent degradation.
3. Memory cap on the external backup service. I added a systemd limit so the Synology agent can no longer, structurally, threaten the machine's overall memory:
# /etc/systemd/system/active-backup-agent.service.d/override.conf
[Service]
MemoryMax=8G
MemoryHigh=6G
4. Monitoring fixed on two blind spots.
The monitoring agent was itself frozen during the incident: it couldn't report the problem while it was happening. I added an alert on absence of metrics reporting, alongside classic "service down" alerts, to detect a frozen server rather than just a dead service.
The memory indicator shown until then was misleading: Zabbix was reporting "available" memory in the broad sense (cache included), which stayed displayed at 33.8 GB throughout the incident without ever moving, while actually free memory was collapsing to 950 MB at the same time. The new item tracks MemAvailable (not raw cache), with an alert threshold at 3 GB and a priority alert at 2.2 GB:
# Fixed Zabbix item
UserParameter=mem.available.mb,awk '/MemAvailable/{print int($2/1024)}' /proc/meminfo
What's still open
The fixes make the system tolerant of a low margin: they don't remove the cause. The internal backup job still, every night, rereads the entire database through the engine's memory. Three organizational leads remain to be decided, closer to business tradeoffs than pure technical ones:
- Exclude the local archive folder from the Synology system image. The volume to image would go from 633 GB to about 148 GB (the biggest win for the least effort): this data is already backups, imaging it again adds no extra protection.
- Space out the system image, which currently runs every hour even though nothing on the OS changes at that frequency: a daily image would be enough to rebuild the machine, with business data staying protected at its own frequency.
- Move the database backups to the NAS uncompressed. This last point matters: the NAS deduplicates (two successive backups of a lightly modified database share 95 to 99% of their content), but a compressed archive changes entirely at the slightest byte modified: deduplication drops to zero and the entire archive gets retransmitted every time. The NAS applies its own compression after deduplication anyway, in the right order.
A complementary lead remains to explore with the engine's vendor: the engine's current configuration has no global memory cap. If such a setting exists, it would address the problem at its real root rather than around the edges.
What I take away from this
A system parameter left at its factory value can stay invisible for months, until an otherwise harmless load lands, one day, with a slightly thinner margin than usual. The real signal wasn't "the backup crashed the server" but "why was the memory margin so low that day": that question, not the freeze itself, is what eventually exposed a deeper problem with no apparent connection to the initial incident.
Two habits worth keeping for the next investigation of this kind:
- Comparing a failing run to a successful one often tells you more than analyzing the failure alone.
- A monitoring indicator that never moves during an incident isn't reassuring: it's a signal that it's measuring the wrong thing.